The real estate market in Indiana is a dynamic and ever-changing landscape, influenced by various factors, including economic conditions, seasonal variations, and buyer and seller behaviors. In August 2023, we witnessed a range of trends and shifts across 16 counties, encompassing all property types. Let's delve into the numbers and understand what the data tells us about the state of Indiana's real estate market.
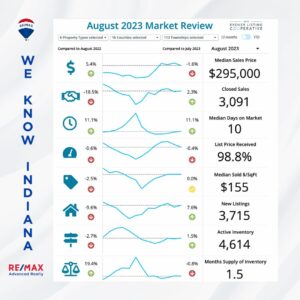
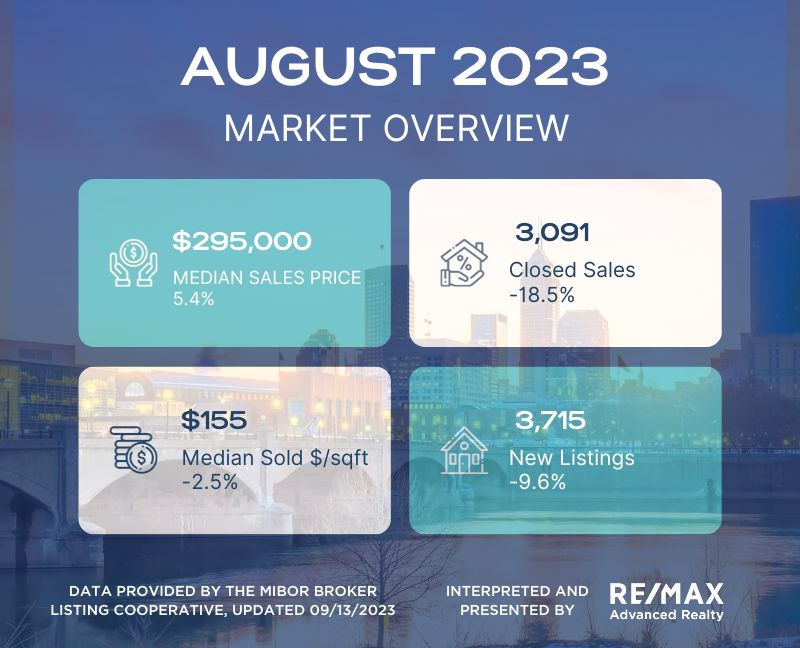
Median Sales Price Soars: The median sales price for all property types combined in August 2023 stood at $295,000. This marked a substantial 5.4% increase compared to the same period in 2022. It's worth noting that the housing market has been experiencing a steady appreciation in property values, which can be an attractive prospect for sellers.
Nevertheless, it's essential to note that the market experienced a modest adjustment when compared to July 2023, showing a 1.6% decrease in median sales prices. This dip could be seen as a sign of market recalibration or heightened competitiveness.
Closed Sales See Mixed Trends: The number of closed sales in August 2023 totaled 3,091, reflecting an 18.5% decrease compared to August 2022. This drop in closed sales might raise some eyebrows, but it's essential to consider various factors such as seasonality and changes in buyer demand.
On a positive note, there was a 2.3% increase in closed sales compared to the preceding month, July 2023. This suggests a potential stabilization in the market and could indicate that buyers and sellers were finding more common ground during this period.
Properties Spend More Time on the Market: In August 2023, properties took a median of 10 days to sell. This represented an 11.1% increase compared to August 2022 and mirrored the increase seen in July 2023. A longer time on the market can be attributed to factors such as increased competition among sellers or buyers becoming more discerning in their choices.
List Price Negotiations: Sellers received an average of 98.8% of their list price in August 2023. While this is still a strong showing, it marked a slight 0.6% decrease compared to August 2022 and a 0.4% decrease compared to July 2023. These changes indicate that buyers may have had slightly more room for negotiation during this period.

Price per Square Foot and Property Sizes: In August 2023, homes were selling at an average price of $155 per square foot. While this was 2.5% lower than August 2022, it's worth noting that there was no change compared to July 2023. This suggests that the real estate market is adjusting to meet evolving buyer preferences and property offerings, which can create new opportunities for both buyers and sellers.
New Listings and Active Inventory: August 2023 saw 3,715 new property listings, which was a 9.6% decrease compared to August 2022. However, there was a notable 7.6% increase in new listings compared to the previous month, July 2023, indicating a potential surge in sellers entering the market.
The active inventory of available properties in August 2023 was 4,614, showing a 2.7% decrease compared to August 2022. Despite this year-over-year decline, there was a 1.5% increase in active inventory compared to July 2023, signifying a potential rise in property availability.
Months of Supply of Inventory: The months of supply of inventory in August 2023 was 1.5, which is a 19.4% increase compared to August 2022. However, it represented a 0.8% decrease compared to July 2023. A months-of-supply metric of 1.5 generally indicates a balanced market, with supply and demand relatively aligned.
In conclusion, Indiana's real estate market in August 2023 displayed a mix of growth and stabilization. Median sales prices continued their upward trajectory, albeit with a slight cooling in July. Closed sales saw a year-over-year decrease but an increase from the previous month. Properties spent more time on the market, and list price negotiations showed some flexibility. The price per square foot and property sizes underwent some changes, suggesting shifting buyer preferences. New listings surged in July, and active inventory increased slightly. The months of supply of inventory pointed towards a balanced market.
As always, the real estate market is influenced by multiple factors, and these statistics provide a snapshot of a dynamic and evolving landscape. Whether you're a buyer or a seller, staying informed about these trends can help you make more informed decisions in Indiana's real estate market
Note: The data mentioned in this article is sourced from the MIBOR Broker Listing Cooperative as of September 14, 2023. The analysis covers 16 counties in Indiana and includes various property types such as Single Family Residence, Condominium, Townhouse, Farm, Residential, and Manufactured Home.
Ready to explore Indiana's dynamic real estate market? Keep in mind that these insights offer only a snapshot of the broader picture. For precise and up-to-date information about your specific area or property, don't hesitate to consult with local real estate professionals. Your dream home or the perfect buyer might be just around the corner.

