When selling your home, timing is crucial. Although spring and summer are often the busiest times for house sales, October still presents a distinct set of opportunities and difficulties.
However, is it really a wise decision to sell your house in the fall?
To help you with this, we've gathered all the pros and cons and other necessary details you need when listing your home during this time of year.
The fact that purchasers are typically more serious is one of the main advantages of selling in the fall. At this point in the year, buyers are frequently keen to get a deal before the holidays or the new year. These driven customers are more inclined to act quickly, which could lead to a quicker sale.
The real estate market tends to cool off in the fall, as opposed to the spring and summer. Your property is more likely to stand out when there are fewer houses for sale. For sellers hoping to draw in serious purchasers, this decrease in competition might be a big benefit.
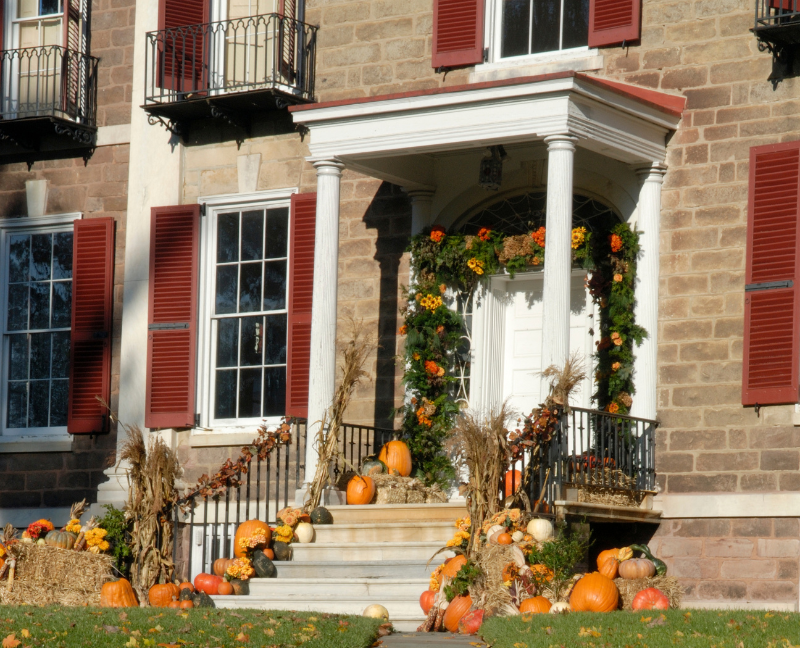
Beautiful curb appeal is naturally complemented by the fall season. Cooler weather and the rich hues of fall foliage may create a welcoming and comfortable house atmosphere. Your home's overall appeal can be improved during this time with small details like warm lighting, seasonal decorations, and a well-kept yard.
You might discover that you have more negotiating power because there are fewer houses for sale. Given their restricted options, buyers in the fall might be more accommodating with bids. Better terms and conditions for your sale may result from this.
There are often fewer buyers searching in the fall, even though they could be motivated. Your pool of possible purchasers may be reduced because many are busy with back-to-school activities, impending holidays, and winter preparations.
Depending on where you live, the fall weather can be erratic and possibly start to snow before your house sells. The presence of rain, wind, or chilly weather can dissuade potential buyers from viewing your home by making open houses and showings less inviting.
There may be less natural light available during showings because the days are shorter in the fall when daylight savings time ends. Potential buyers could not fully appreciate your home's best qualities if they are visiting in the evening or after work. To make up for the shortened daylight hours, make sure your house has adequate lighting.
As the fall season moves into the holidays, many shoppers shift their attention to family gatherings, holiday shopping, and travel arrangements. This might cause delays in decision-making, with some consumers waiting until after the holidays to make a purchase.
Here are some pointers to think about to increase your chances of a successful fall house sale:
Take advantage of the fall season by arranging your house to create the warm, inviting ambiance that prospective buyers frequently seek at this time of year. Warm colors, comfortable textures, and seasonal décor can help prospective buyers picture themselves living in your house and make it feel welcoming.
Your yard may suffer from falling leaves and colder temperatures. Be sure to maintain a clean and debris-free yard. To make a visually appealing façade that attracts buyers, rake leaves, trim bushes, and think about adding fall flowers.
Setting your home's price correctly from the start is critical because there are fewer buyers on the market. Together with your real estate agent, determine a fair price for your house based on current market conditions. In the fall market, overpricing may make your house sit on the market for longer than anticipated.
Due to their hectic schedules, buyers might not be able to visit homes as often in the fall. To draw in more buyers, be adaptable with showings, provide virtual tours if you can, or allow weekend and nighttime visits.
Bottom Line
Selling a home in the fall has its own advantages and disadvantages. Those who are looking for properties are frequently more driven to close before the holidays, even if there may be fewer buyers on the market. Additionally, you may benefit from less competition, which helps your listing stand out easily.
However, if you want a quick sale, it might be hampered by inclement weather, shortened days, and holiday diversions. You may maximize the fall real estate market and possibly secure a successful sale by being aware of these elements and preparing your house appropriately.
As always, we're more than happy to assist you whether you're buying or selling a home in the fall. Just leave a comment or email us at dennis@indyhomepros.com today!
For those who have started to browse our website on homes for sale, as well as properties in the surrounding area, there are massive advantages to viewing homes that you are considering in person. Although virtual tours and online profiles can provide exceptional detail regarding the homes you view, they cannot reveal everything. Instead, getting an up-close look at a single-family house or luxury townhome can paint a picture of what it would be like to live on the property.
You have two choices for in-person property viewing: private tours and open houses. Each has its own set of advantages and disadvantages. To help you know which suits your current needs, we've provided the main pros and cons below.
PRO: You'll be able to see the neighborhood up close
The chance to tour the area is one of the key benefits of going to an open house. Realtors frequently invite neighbors and other community members to open house events.
This allows potential buyers to interact with possible neighbors and obtain unbiased perspectives about what it's like to live in the community. The number of residents who attended but are not interested in purchasing the property can vary depending on the area's size and layout. There is very little likelihood of meeting your new neighbors on a private tour.
There's freedom to come and go during the designated event times at open houses. You are free to take a break, go for a tour of the area, and then return to speak with the realtor. On the other hand, private tours are by appointment only, therefore this is not a possibility.
CON: The event can be super busy
There are advantages to meeting possible new neighbors, but there are drawbacks to large gatherings. This is particularly true for properties in high demand since they can draw dozens of potential buyers to a single open house.
Private tours are frequently the better option if you are someone who doesn't like crowds. On the other hand, if a private tour isn't offered for a certain house, make an effort to go to weeknight open houses. These only draw serious purchasers and are typically less crowded than weekend open houses.
PRO: No pressure to make an offer
Attending an open house is a low-stress endeavor. There are a lot of people there, so it's easy to come and go without getting seen (if desired). You can feel much less anxious about the scenario because you do not receive the personalized attention that you would in a private tour.
This is particularly beneficial for those who are just beginning the home-buying process and are unsure of their future residence. You made up your mind not to like the house? Not an issue. There will be many other people there who will probably fall in love with the property.
Ask questions as they come up during your self-guided tour, which you can take at your own speed.

PRO: Receive one-on-one attention the entire time
When it comes to house tours, are you the type of person who prefers a more exclusive, posh experience? Making reservations for private property visits is, without a doubt, your best option.
You will have one-on-one attention from an agent the entire time your reservation is made. You can ask as many questions as you'd like, and there's no danger of getting lost in the crowd. To increase your chances of having your offer accepted while you are contemplating a home, it is essential to arrange a private tour.
If you don't like the feeling of being rushed, private tours offer a laid-back setting where you can examine each area at your leisure, pose questions, and get a sense of the overall design.
In the end, choosing a proactive tour will help you feel less stressed during this hectic period of your life. During a private tour, a professional real estate agent will never make you feel rushed or constrained by their schedule.
Cons: Not ideal for first-time homebuyers
Have you just started looking for a place to buy? If so, there's a chance you don't currently have an agent you can work with to arrange a private trip. You need to make an appointment with an agent for a private home tour before you are allowed to visit the property.
Taking a personalized tour could seem like a high-pressure commitment, even if you have an agent already. People who are just beginning the process of becoming homeowners might want greater liberty and flexibility to come and go as they choose, without having to respond.
Pro: Establish a connection with your realtor
Having the chance to get to know your realtor is just another fantastic advantage of setting up one or more private visits. You can begin establishing a rapport with your selected real estate agent after just one trip.
This will help your realtor understand your tastes and personality better, which will ultimately help them choose the kind of house you are most interested in. You will consequently be matched with your ideal Indiana home faster.
If you're looking for the best realtor in your area, we have one for you! Just let us know where you're from and your concern -- buying or selling a home and we'll guide you.
Leave a comment or send us an email to get started: dennis@indyhomepros.com
Have you had your house up on the market for a long time, but you're not getting many responses from potential buyers? If yes, you might find yourself wondering why your house isn't selling."
More often than not, the financial aspect of the transaction has a greater influence on why a house stays on the market longer than anticipated.
According to data from the Federal Reserve Bank of St. Louis (FRED), houses in the US were on the market for a median of 43 days as of May 2023. Compared to the June 2021 purchasing frenzy, when homes were on the market for a median of just 35.5 days, this is a modest uptick.
Numerous factors, including alterations in buyer behavior, variations in inventory levels, and variations in property prices, could be responsible for this trend.
In this post, we will talk about the usual causes of why your home is not selling and provide expert tips on how to make things better.
It's normal to be concerned if your house isn't selling as soon as you want, as selling a house is a big undertaking.
When your home is for sale, keep an eye out for these crucial indicators that suggest it may be time to get concerned:
Above Average Days On Market: You should be concerned if your house has been on the market for a longer period than the median days on the market that your neighborhood is currently seeing. The average number of days that US properties were listed for sale was 43 as of May 2023. It may be time to reconsider your approach if your house has been on the market for a longer time than this without drawing any solid offers.
Changes in Home Prices: If the value of homes in your neighborhood is dropping and the price you have set for your house is based on earlier, higher values, prospective buyers may think it is too expensive. The median price of a home has decreased somewhat in 2023.
Consistently Negative Feedback: If prospective buyers are consistently commenting negatively on certain features of your house, such as the design, condition, or asking price, this may indicate that adjustments need to be made.
Few Showings or Low Online Interest: If your home isn't having many showings or if there isn't much interest being generated by the online listing, that's another indication that you should be concerned. This may mean that buyers aren't finding your house appealing for whatever reason—it might be the pricing, the quality of the images, or the marketing strategy used.
A property's saleability is influenced by a wide range of elements in the dynamic real estate market. These factors may include an expensive listing, a slow real estate market, the need for renovations, insufficient advertising, or even the absence of a knowledgeable real estate agent.
Additionally, external factors such as economic trends, mortgage rates, and seasonal swings might also play an impact.
Here are some reasons why your home might not be selling:
A significant portion of prospective buyers will not be interested in your home if it is priced higher than they would expect for the neighborhood. You must conduct some study to determine whether your home is too expensive or not.
To find out what comparable properties have sold for in your community, check up recent sales. This is a good estimate of the worth of your home if you can locate a recently sold home in your community with comparable square footage, number of bedrooms, and number of bathrooms. Working with your real estate agents and asking relevant questions can help, too.
The best course of action, if your home has been overpriced, is to reduce the price to closely match the properties in your neighborhood. This can make your house appeal to more purchasers and have a higher chance of selling.
Potential purchasers may be turned off by your home's need for repairs unless you are specifically offering it as an as-is fixer-upper. Make sure to address any significant problems, such as leaks, cracks, or holes in the walls, before listing your house for sale. It's advisable to think about doing some aesthetic adjustments, such as repainting the walls or changing the fixtures.
By making these adjustments, you'll attract more purchasers and expedite the sale of your house.

Home prices are declining and property markets are cooling across the US. This can be a major factor in the failure of your house to sell.
It could take longer for your house to sell if the local real estate market is sluggish, especially if you're not getting the price you want. Although you frequently have little influence over this, you still have choices.
In a weak market, you can assist sell your house by lowering the listing price, providing incentives, or being flexible with the closing date. Another option would be to rent out your house while you wait for the market to improve.
It's possible that your house isn't selling because you didn't take the time to stage it for pictures and showings. The speed at which your house sells may be impacted by the staging you do.
It will be challenging for purchasers to appreciate the potential in your house if it is disorganized or unkempt.
Before marketing your house, make sure to thoroughly clean and clear it. You should also consider hiring a professional stager to assist you arrange furniture and décor in a way that is attractive to the eye.
Your home will appeal to more buyers and have a higher chance of selling quickly if you take the time to prepare it appropriately.
Your home may take longer to sell if it is in a poor neighborhood. Although you normally have little control over this, there are some things you may do to lessen its impact.
Keeping up with the upkeep of your house is one thing you can do. This will increase its appeal to buyers and help it stand out from other houses in the neighborhood. In your listing, make sure to emphasize any advantages the location may have. Mention things like how close your house is to parks or reputable schools.
Even though you are unable to relocate your house, there are still things you may do to improve its appeal to potential purchasers.
When a prospective buyer pulls up to your house, they will first notice the exterior. Buyers may be put off by your house's unattractive outside before they ever enter.
Organizing the yard is the first step in increasing curb appeal. Trim the lawn and get rid of any dead plants or weeds. To give a pop of color, you should also think about adding some potted flowers or plants.
Next, shift your focus to the exterior of the house. If required, pressure wash the siding and clean the windows and doors. These small adjustments can have a significant impact on how buyers find your house.
The majority of purchasers in today's digital environment begin their search for a home online. This implies that the images of your house are crucial. Buyers will be turned off by dark, grainy, or oddly angled images and will be less inclined to come to view your house in person.
Ensure working with a professional photographer to get stunning images of your house. The nicest aspects of your house should be highlighted in these pictures, making it appear as welcoming as possible.
A buyer's first thought when viewing an outdated-looking home is probably going to be extensive upgrades. That alone is enough to bring to mind visions of an enormous undertaking with an expensive price tag.
There are a few things you may do to update the style of your property if it isn't very appealing to purchasers. Modernizing the hardware and fixtures around the house is one thing you may do. This covers hardware such as cabinet knobs, light fixtures, and door handles.
You might also try painting the walls or changing out the flooring. Although these modifications may cost more money and time, they can significantly update your house and increase its buyer appeal.
These are reasonably priced improvements that can significantly alter the way your house looks overall.
These are just some of the reasons why your home might not be selling. In the second part, we'll talk more about this and help you address them so you can sell your property quickly.
It's not too late if your goal was to sell your house before fall but you haven't found the ideal buyer yet. Many homeowners believe that selling their house in the spring and summer will benefit their chances of getting a higher price. However, selling your house before the end of the year has several advantages, too.
That said, we recommend that you consider a fall listing. The fact that there are still a lot of buyers out there searching for the ideal house might surprise you. Additionally, you lose out on possible purchasers for your house if you remove it from the market or never list it at all. Let's find out the advantages of selling your house before the end of the year.
Eliminating competition is one of the main advantages of listing your house in the fall. There will be more interested purchasers for your home because the majority of home sellers have the mindset that their property won't sell because autumn has arrived.
A higher selling price could also arise from little or no competition. Buyers who aim to move into their new home before the holidays are more likely to make an offer at or near the asking price.
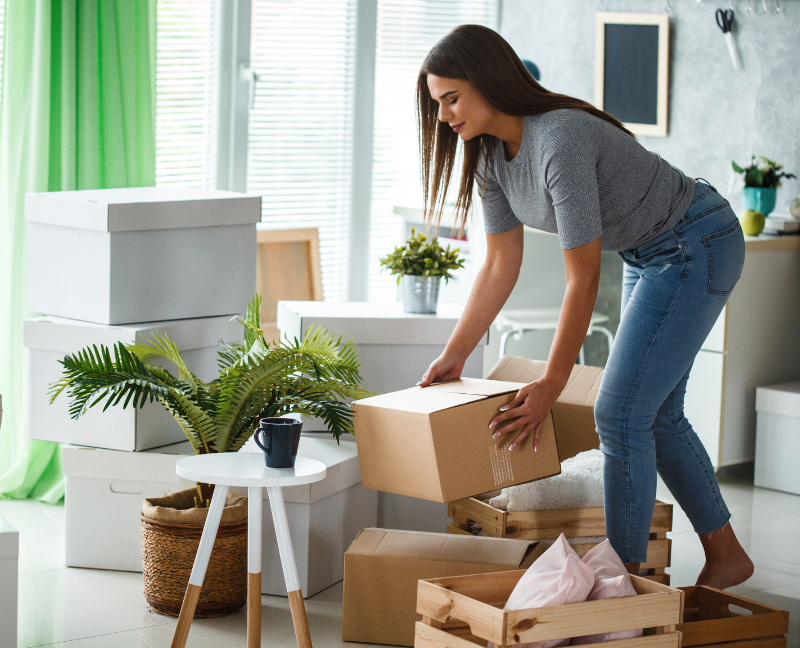
You might believe that listing your home in the fall or winter will never result in a sale. After all, moving will be challenging due to the weather. However, you want to take advantage of that point. It could seem urgent to a buyer to relocate before the worst of the weather arrives. A quicker sale and a higher price could arise from this.
Just make sure your home is ready for a move-in. That will facilitate its speedy sale when the inclement weather and the holidays get near. Customers will feel more at ease knowing that they won't need to do much work on it and that it will be livable until the time comes for them to update the color schemes to their preferences.
The fact that this is the off-season for home purchases is well-known to banks and lending organizations. Because of this, purchasers have access to lower interest rates. They will want to purchase that house before the rates rise once more, which will be advantageous to you as the seller.

When purchasing or selling a home before the end of the year, there are tax benefits available to both parties.
The interest paid on the mortgage will be deductible for the buyer, which is advantageous regardless of the size of the amount. The ability to deduct property taxes and, in certain situations, closing expenses is another tax benefit available to homebuyers.
As previously mentioned, purchasers will have fewer options when they sell in the fall or winter. As long as it is inside the market, your chances of getting the price you want are higher. You can always count on a speedy sale of your house if you price it correctly. It will be more favorable for buyers to purchase in the fall or winter when there is less likelihood of a bidding war.
Arranging a fall or winter ad will bring in lots of business for both you and your buyers in the furniture and hardware stores in your community. A wide range of home remodeling products, along with alternatives for furniture, décor, and lighting, are on sale.
You can see that there are many excellent reasons to sell your house in the winter or fall. Never listen to someone who suggests something is difficult or perhaps impossible. To help you with the sale of your house, there are a few things you should do:
Our team at RE/MAX Advanced Realty is dedicated to helping you sell your home fast and seamlessly. Call us today or leave a comment to get started.
Many people have false beliefs about leading an eco-friendly lifestyle, especially the notion that it's costly, difficult, and calls for a full head of dreadlocks.
Being green really isn't that hard; all it takes is one small adjustment at a time to benefit the environment.
And here's the huge bonus: You may frequently save money by implementing these tiny lifestyle adjustments.
Here are the eco-friendly tips for home that can help save money:
For most homes, energy costs represent a considerable monthly expense, and domestic energy use significantly contributes to environmental problems. Improving energy efficiency can substantially lessen your influence on the environment and electricity costs. Still, some of these improvements require much effort and money.
In addition to discounted costs for energy-efficient upgrades and appliances, several utility providers now give free energy audits and rebate programs. Look for deals you can take advantage of by first visiting the websites of your gas and electric suppliers. In addition, you can determine if you qualify for any federal income tax credits associated with energy conservation.
After exploring these promos and incentive programs, inventory your home for energy efficiency improvements and investigate low-cost renovations to reduce energy consumption:
Summer may be filled with more activities compared to other seasons, so it might require an effort to find enough time to clean, organize, and refresh your home. After all, doing so has environmental, financial, and even mental benefits for you and your family.
Here are some ideas for recycling, reusing, and reducing items that are already in your home:
There are many cheap, eco-friendly things you can do on your lawn that could have a beneficial impact on your finances and the environment, such as:
Plastic water bottles that are only used once are extremely wasteful and harmful to the environment.
Three times as much water is needed to make one water bottle as there are in one due to the plastic production process, yet an estimated 80% of them are not recycled!
Regretfully, they wind up in landfills or the ocean since individuals frequently neglect to recycle them correctly.
Purchasing a reusable, appropriately sized water bottle will solve this issue and allow you to carry it with you everywhere you go.
Long-term cost savings are also achieved by reusing water bottles since fewer plastic bottles will need to be bought.
Reducing your meat intake can actually have a significant positive impact on the environment.
Livestock operations occupy more than thirty percent of the Earth's surface.
In line with a UN research, “the livestock sector accounts for 9 percent of CO2 deriving from human-related activities, but produces a much larger share of even more harmful greenhouse gases. It generates 65 percent of human-related nitrous oxide, which has 296 times the Global Warming Potential (GWP) of CO2.”
Reducing your meat intake is a significant step in lowering your total GWP gas emissions.
We can enjoy and use more land for pleasure when there are less cattle on it.
Think about eating more fish or substituting veggies for some of your meat-heavy meals!
First of all, you don’t have to completely get rid of your paper towels; however, use them sparingly as much as you can.
Comparing the seven most popular ways for drying hands, researchers at Massachusetts Institute of Technology (MIT) discovered that using paper towels results in 70% more carbon emissions than using hand dryers with cold air.
Even though you most likely don't have a hand dryer at home, drying off with a cotton towel is 48% more environmentally friendly than using a paper towel.
When the time comes for your spring cleaning, chop up an old t-shirt and use it as a cloth instead of buying a dozen rolls of paper towels.
Since you were going to discard it anyhow, why not make financial and environmental savings simultaneously?
Gather all of your used rags into a basket and give them a quick wash.
Reuse, reuse, reuse!
Light switches are beside the door for a reason!
Turn them off whenever you leave a room, and especially when you leave the house. This will help you save energy and money on your energy bill.
Your ability to save energy by shutting off the lights will vary depending on the kind of bulbs you use.
An incandescent lightbulb is among the least energy-efficient forms of illumination available.
Just 10% of the energy used by incandescent light bulbs is converted to light; the remaining 90% is wasted as heat.
Therefore, you can save more energy in your home by turning off your incandescent light bulbs.
Since halogen lights employ the same technology as incandescent light bulbs, turning them off when not in use can also help cut energy bills.
It is also necessary to turn off compact fluorescent lights, or CFLs, according to the usual rule of thumb.
If you plan to be back in your room in fifteen minutes, you can leave the lights on.
But turning them off is more energy-efficient if you leave your home for longer than fifteen minutes.
Your CFL bulbs' lifespan will also be increased by using this technique.
Nevertheless, turning on or off Light Emitting Diodes, or LED bulbs, will not have an impact on them.
One of the key features of LED bulbs that makes them perfect for energy conservation at home is this.
Additionally, you can use sensors to turn them fully on and off instantaneously and to turn them on and off automatically.
Other than this, unplug appliances when you’re not using them.
Want more tips on taking care of your home and living an eco-friendly lifestyle? Why not check our free resources by clicking this link.
Green roofs provide both a natural and symbolic breath of fresh air in the busy concrete jungles that are today's cities. These inventive installations improve urban landscapes and the environment by decreasing heat, stormwater runoff, and air pollution.
This post will discuss how green roofs work, enabling city people to develop thriving green areas on top of their structures. The below ideas will show you how to grow beautiful green roofs and how they benefit the environment and community, whether you're a seasoned gardener or a beginner.
Plant-filled green roofs are also called living roofs. They are environmentally friendly and encourage sustainable development. Creating a green roof requires a waterproofing membrane, root barrier, drainage layer, growing medium, and vegetation. Green roofs' main goals are sustainable energy, stormwater management, and a healthy environment.
Green roof vegetation and substrate absorb precipitation, lowering pressure on drainage systems and flooding danger. As insulation, green roofs reduce heating and cooling needs, minimizing building energy consumption. They improve air quality and mitigate climate change by catching pollutants and carbon dioxide.
Meanwhile, rooftop gardens extend green roofs into outdoor living spaces for cultivation, recreation, and community participation. Beyond ecological benefits, rooftop gardens emphasize social and economic benefits.
Rooftop gardens are communal and entertainment settings. Sitting places, strolling trails, and playgrounds can be added to these gardens to create relaxing, social, and community spaces. It can also be a place where residents relax and connect by providing a break from city life.
Urban agriculture should be done outside to encourage sustainable food production. On your rooftop patio, grow fruits, veggies, and herbs in raised beds or containers. Use composting to recycle organic waste and feed plants.
Sustainable rooftop greenhouses mix agriculture and design. These unique structures allow rooftop farming of fresh produce. Sustainable design improves rooftop greenhouses' environmental performance. Install rainwater collecting, solar panels, and composting facilities to lessen your roof decking's ecological impact.
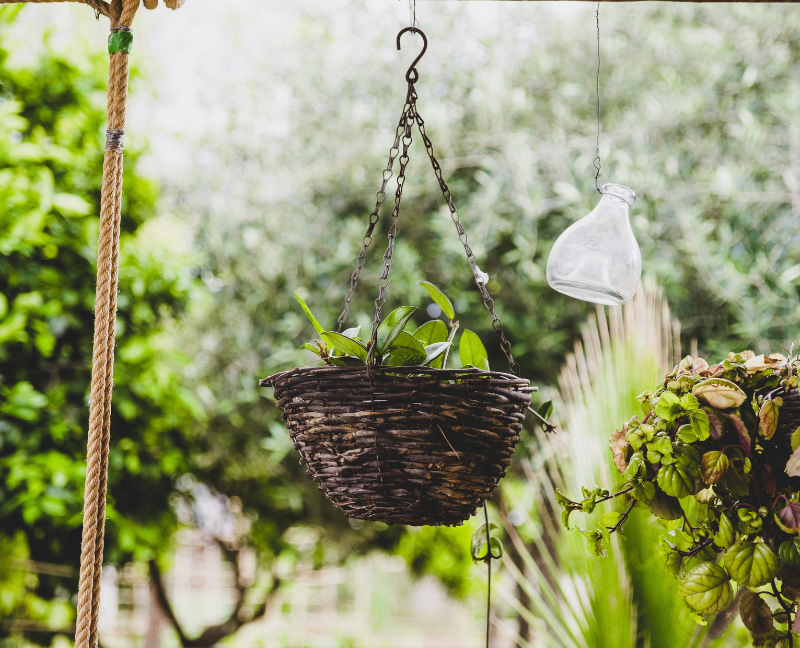
Hang baskets, pots, and cascading vines from pergolas or trellises. These designs produce a green curtain effect and provide visual appeal to the rooftop deck or patio, making it a beautiful green retreat. Rooftop greenhouses improve energy efficiency, air quality, and food sustainability using vertical space and modern growing methods.
Create rooftop greenhouses with giant planters or raised beds. Easy maintenance, plant selection, and transportation are possible with this strategy. It works for studio apartment rooftop terraces with weight limits or limited space.
Plant local herbs and medicinal plants on your rooftop patio. Put culinary, medicinal, and fragrant herbs in separate sections. Practice and wellness are combined in this design.
Native plants thrive in local climates, require less care, and shelter wildlife. Ecological balance and indigenous plant conservation are achieved using this method.
Make rooftop gardens into sustainable and learning areas. Signage, information boards, and interactive displays could explain rooftop gardens, native plants, and other eco-friendly techniques.
Make the rooftop terrace a relaxing urban home. Create a soothing atmosphere with fountains or tiny ponds. Plants, trees, and water elements make these gardens a welcome respite from the city. They help preserve urban biodiversity by housing birds, butterflies, and other animals.
Creating a rooftop garden outdoor living space lets you relax, connect with nature, and enjoy the scenery. Select comfortable and sturdy outdoor furniture that matches your style and preferences, offers comfy seats and shade structures, and adds fragrant plants to enhance the sensory experience, illumination, and relaxation. For extra coziness, add plush cushions and pillows.
A rooftop terrace seamlessly connects indoor and outdoor living spaces. Residents may rest, party, and enjoy city views in its adaptable outdoor living and dining area. Rooftop terraces offer a retreat from the city with lounge seats, dining areas, and hot tubs. Design your roof decks for inspiration, socializing, and outdoor activities. It can create relaxing lounges or dining areas beneath covered pergolas.
Conclusion
Rooftop makeovers serve as an inspiration for creative design concepts and upcoming advancements in the building sector. Green areas are being incorporated into building designs by architects and urban planners, who are putting sustainability and the welfare of the community first.
8313 W. 10th St
Indianapolis IN 46234
dennis@indyhomepros.com
317-316-8224